July 01, 2025, 11:19:00 GMT
permalink Post: 11914164
Not really relevant to what you quoted though, as the scenario in question requires:
-
Engines running on centre tank fuel during takeoff
while the aircraft is operating normally
- We don't know for certain if this is the case. It seems to be but it's not something that happens on other families.
- Then, total AC failure stopping fuel boost pumps.
- Engines suction feed from contaminated/full-of-water wing tanks.
I know that the engine driven pumps have documented limitations and that the regulations allow for some limitations. I know that at least one of these limitation is high altitude and I _suspect_ that the design intends for this unlikely scenario (engine driven fuel pumps alone with no AC pumps) to guarantee enough fuel flow to get to an airport and land. I also suspect that the APU is expected to solve loss of all AC generators - and as we know, there wasn't enough time for it to start in this scenario.
The limitations at high altitude are primarily air/volatiles degassing out of the fuel. That's not going to be much of an issue at sea level, even if the engines are a bit higher up during rotation.
APU is a nice-to-have; it's on the MEL. If you lose all four generators, it's because of some major carnage in the electrical software/hardware and chances of putting the APU on line even if it's operating are very slim.
Subjects
APU
Centre Tank
Fuel (All)
Generators/Alternators
MEL
RAT (All)
RAT (Deployment)
Links are to this post in the relevant subject page so that this post can be seen in context.
The thread is closed so there are no user likes are available and no reply is possible.
July 01, 2025, 11:42:00 GMT
permalink Post: 11914172
My question is: what caused the RAT to deploy on those flights? Presumably reports have to be submitted in those cases?
ASN has a section on electrical power incidents: https://asn.flightsafety.org/asndb/cat/ACSE
In particular try these:
https://assets.publishing.service.go...009_G-EZAC.pdf
https://asn.flightsafety.org/wikibase/233343
https://asn.flightsafety.org/wikibase/219748
https://asn.flightsafety.org/wikibase/34357
Subjects
RAT (All)
RAT (Deployment)
Links are to this post in the relevant subject page so that this post can be seen in context.
The thread is closed so there are no user likes are available and no reply is possible.
July 01, 2025, 12:38:00 GMT
permalink Post: 11914210
Subjects
RAT (All)
RAT (Deployment)
Links are to this post in the relevant subject page so that this post can be seen in context.
The thread is closed so there are no user likes are available and no reply is possible.
July 01, 2025, 13:06:00 GMT
permalink Post: 11914222

As the aircraft visibly continues to climb past that height (and for a longer period than ADS-B data covers, if the camera's perspective casts doubt on that), it seems rather clear to me that it reached its peak height past the end of the runway.
In light of this I find the fact that people keep calculating a glide from the runway to the crash site to be a bit strange. Wouldn't the first step of any math be to try to determine where it started descending?
Subjects
ADSB
RAT (All)
RAT (Deployment)
Links are to this post in the relevant subject page so that this post can be seen in context.
The thread is closed so there are no user likes are available and no reply is possible.
July 01, 2025, 14:05:00 GMT
permalink Post: 11914261
As the aircraft visibly continues to climb past that height (and for a longer period than ADS-B data covers, if the camera's perspective casts doubt on that), it seems rather clear to me that it reached its peak height past the end of the runway.
In light of this I find the fact that people keep calculating a glide from the runway to the crash site to be a bit strange. Wouldn't the first step of any math be to try to determine where it started descending?
Subjects
ADSB
RAT (All)
Links are to this post in the relevant subject page so that this post can be seen in context.
The thread is closed so there are no user likes are available and no reply is possible.
July 01, 2025, 14:36:00 GMT
permalink Post: 11914278
Cavitating destroys pumps rapidly - someone upthread said replacing the fuel pump immediately is SOP if it has suction fed. Expect end of life in tens of hours rather than tens of thousands.
Some aircraft have switched to using jet/venturi pumps powered by returned fuel, like the A220. The electric boost pumps there are mainly for redundancy and are shut down in cruise; only one in each wing tank. Some A320s replace the centre override pumps with venturi transfer pumps.
My question is then: what is the minimum loss of thrust in both engines (perhaps more relevantly expressed as a % in fuel flow reduction from expected) that could produce the profile we saw. I appreciate this is a figure with many variables including timing and rate of loss.
The reason I think this question is relevant is because we pretty much have 2 prevailing theories at this point:
- A failure, or reduction of thrust (below idle, indicated by loss of AC generators), that somehow impacted both engines, within 20s of rotation (explaining the RAT and gear orientation)
- Somehow a loss of all AC power, leading somehow to a reduction of thrust or failure of engines (both engines impacted identically is assumed in this scenario since all AC is lost), and was of course below the minimum thrust needed to fly with gear down at this weight and temperature
Subjects
Fuel (All)
Generators/Alternators
RAT (All)
Links are to this post in the relevant subject page so that this post can be seen in context.
The thread is closed so there are no user likes are available and no reply is possible.
July 01, 2025, 15:04:00 GMT
permalink Post: 11914293
The cctv neither confirms nor denies that top of climb could be as high as 270'. My 1km/200' estimate was conservative. I guessed 160kt average over the 7s to allow for the 25007 wind
and some deceleration.
Basically you cannot rule out loss of thrust around the time of loss of electrics.
Subjects
RAT (All)
Links are to this post in the relevant subject page so that this post can be seen in context.
The thread is closed so there are no user likes are available and no reply is possible.
July 09, 2025, 13:45:00 GMT
permalink Post: 11918371
edited to add, after reading about the 787 it seems it uses electrical power to start. Same sort of issue though if not enough power, which is likely given the RAT was out.
Last edited by SloppyJoe; 9th July 2025 at 13:57 .
Subjects
Fuel (All)
Fuel Cutoff Switches
RAT (All)
Relight
Links are to this post in the relevant subject page so that this post can be seen in context.
The thread is closed so there are no user likes are available and no reply is possible.
July 10, 2025, 02:30:00 GMT
permalink Post: 11918727
Subjects
Fuel (All)
Fuel Cutoff Switches
RAT (All)
Relight
Links are to this post in the relevant subject page so that this post can be seen in context.
The thread is closed so there are no user likes are available and no reply is possible.
July 10, 2025, 02:41:00 GMT
permalink Post: 11918730
* (Or to be fair, these guys, this cockpit team were...)
Last edited by MaybeItIs; 10th July 2025 at 02:55 . Reason: grammar (still bad, never mind), a bit better 2nd time
Subjects
Fuel (All)
Fuel Cutoff Switches
RAT (All)
Links are to this post in the relevant subject page so that this post can be seen in context.
The thread is closed so there are no user likes are available and no reply is possible.
July 10, 2025, 09:59:00 GMT
permalink Post: 11918849
I don't see it written in the 787 FCOM but I have always been told that the action of resetting the Engine Cutoff switches in the event of a dual engine failure, is merely backing up what the FADECs have already done. If there is an 'engine event' the FADECs will manage ignition and fuel-flow to restore the thrust that was demanded before the event. If that management has failed then the manual resetting may be more successful. (The same holds true for the RAT, manual selection is merely backing up the auto-deployment).
Any airline pilot will tell you that executing an in-flight relight on a big engine, no matter if it is by electric start, windmilling RPM or cross-bleed assisted, can take between 1 and 3 minutes to restore power. This aircraft was airborne for less that 30 seconds. No pilot in his right mind would prioritise an in-flight relight procedure, in a situation where they had neither the time, the height nor the speed for it to succeed. I have no doubt the crew focussed entirely on pointing the aircraft at the clearest area they could see, to mitigate what would inevitably follow.
Subjects
Dual Engine Failure
Engine Failure (All)
FCOM
Fuel (All)
Fuel Cutoff Switches
RAT (All)
Relight
Links are to this post in the relevant subject page so that this post can be seen in context.
The thread is closed so there are no user likes are available and no reply is possible.
July 10, 2025, 14:18:00 GMT
permalink Post: 11919024
- They know exactly 1 fuel switch was cut off, perhaps implying single engine failure + wrong engine shutdown
- They know 1 or both switches were cycled off then on, implying a last-ditch attempt at some sort reset at any point up to say ~30s
- They know both fuel switches were cut off, and remained off, implying sabotage
- If the cut off happened within 20s of leaving the ground perhaps it could explain why CCTV shows the initial climb then level for ~10s before descent. It could also explain the RAT and gear trucks perhaps if gear up was delayed? However, in this scenario they must know that the engine failed, that information would be clearly recorded and surely the leak would lead with that info? Also 'switches' is plural implying both, the radio call didn't mention single engine failure and like you say its quite hasty, even within 20s.
- Again assuming switches plural, this implies either of the prevailing theories of dual engine failure leading to loss of AC or loss of AC leading to reduced thrust or engine failure. However, it also seems strange to lead with that info rather than the state of the engines or electrical systems in any flight data, unless someone can explain how the data would be impacted?
- If this was the case then it would imply that there is no voice or engine data to explain the cut off, nothing was said and the engines were normal up until that point
Subjects
CCTV
Dual Engine Failure
Engine Failure (All)
Engine Shutdown
Fuel (All)
Fuel Cutoff Switches
MAYDAY
RAT (All)
Links are to this post in the relevant subject page so that this post can be seen in context.
The thread is closed so there are no user likes are available and no reply is possible.
July 11, 2025, 21:40:00 GMT
permalink Post: 11919771
- on take off roll both engines lost power as the fuel cut offs went from RUN to cutoff
- CVR recorded one pilot asking why they had gone to CUTOFF
- within 10 seconds the fuel cutoff was moved back to RUN
-RAT was deployed, APU had begun auto start
- 32 seconds after Vr the MAYDAY was called
This should also dispel a lot of the comments about AAIB-India, Indian culture in general and general competence. For a preliminary report this is far more thorough and extensive than what would normally be expected and they\x92ve kept Boeing, GE, FAA and investigators from US, UK, Canada and Portugal in the loop from the start
They have also clarified why it took so long to do the EAFR download- because of the extensive damage they had to source specialist equipment from the NTSB that only arrived on the 23rd of June (they downloaded on the 24th) so all that talk of a \x91coverup\x92 is pretty embarrassing now
of course the big question is why/how those switches were commanded into cutoff in the first place the exact sequence at Vr is the most critical, there hasn\x92t been much scrutiny at all that I can see in the Indian/international media of the personal
background of the flight deck crew which has happened in other suspected pilot initiated disasters in the past, I guess this is an avenue investigators will have been doing themselves
Subjects
APU
CVR
EAFR
FAA
Fuel (All)
Fuel Cutoff
Fuel Cutoff Switches
MAYDAY
NTSB
Preliminary Report
RAT (All)
RAT (Deployment)
RUN/CUTOFF
Links are to this post in the relevant subject page so that this post can be seen in context.
Reply to this quoting this original post. You need to be logged in. Not available on closed threads.
July 11, 2025, 21:40:00 GMT
permalink Post: 11919772
UTC and immediately thereafter, the Engine 1 and Engine 2 fuel cutoff switches transitioned
from RUN to CUTOFF position one after another with a time gap of 01 sec. The Engine N1
and N2 began to decrease from their take-off values as the fuel supply to the engines was cut
off.
In the cockpit voice recording, one of the pilots is heard asking the other why did he cutoff.
The other pilot responded that he did not do so.
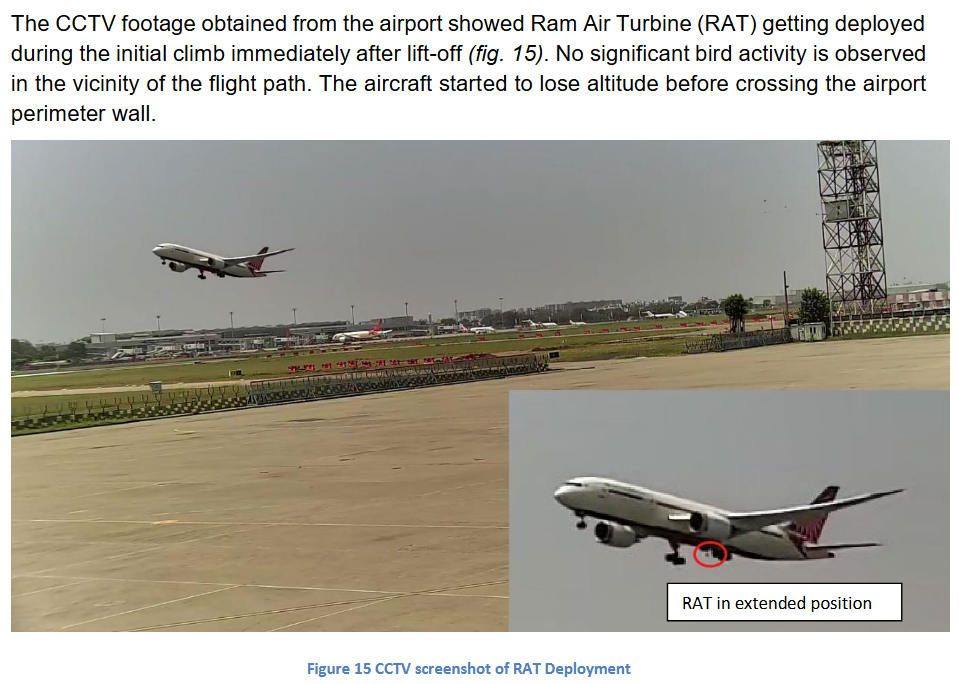
The CCTV footage obtained from the airport showed Ram Air Turbine (RAT) getting deployed
during the initial climb immediately after lift-off (fig. 15). No significant bird activity is observed
in the vicinity of the flight path. The aircraft started to lose altitude before crossing the airport
perimeter wall.
As per the EAFR, the Engine 1 fuel cutoff switch transitioned from CUTOFF to RUN at about
08:08:52 UTC. The APU Inlet Door began opening at about 08:08:54 UTC, consistent with
the APU Auto Start logic. Thereafter at 08:08:56 UTC the Engine 2 fuel cutoff switch also
transitions from CUTOFF to RUN. When fuel control switches are moved from CUTOFF to
RUN while the aircraft is inflight, each engines full authority dual engine control (FADEC)
automatically manages a relight and thrust recovery sequence of ignition and fuel introduction.
The EGT was observed to be rising for both engines indicating relight. Engine 1’s core
deceleration stopped, reversed and started to progress to recovery. Engine 2 was able to
relight but could not arrest core speed deceleration and re-introduced fuel repeatedly to
increase core speed acceleration and recovery. The EAFR recording stopped at 08:09:11
UTC
As per the EAFR data both engines N2 values passed below minimum idle speed, and the
RAT hydraulic pump began supplying hydraulic power at about 08:08:47 UTC.
RAT in extended position
15
As per the EAFR, the Engine 1 fuel cutoff switch transitioned from CUTOFF to RUN at about
08:08:52 UTC. The APU Inlet Door began opening at about 08:08:54 UTC, consistent with
the APU Auto Start logic. Thereafter at 08:08:56 UTC the Engine 2 fuel cutoff switch also
transitions from CUTOFF to RUN. When fuel control switches are moved from CUTOFF to
RUN while the aircraft is inflight, each engines full authority dual engine control (FADEC)
automatically manages a relight and thrust recovery sequence of ignition and fuel introduction.
The EGT was observed to be rising for both engines indicating relight. Engine 1’s core
deceleration stopped, reversed and started to progress to recovery. Engine 2 was able to
relight but could not arrest core speed deceleration and re-introduced fuel repeatedly to
increase core speed acceleration and recovery. The EAFR recording stopped at 08:09:11
UTC
At about 08:09:05 UTC, one of the pilots transmitted “MAYDAY MAYDAY MAYDAY”.
08:08:42 Engine 1 and Engine 2 fuel cutoff switches transitioned from RUN to CUTOFF position.
One of the pilots asks the other why did he cutoff.
The other pilot responded that he did not do so.
08:08:52 Engine 1 fuel cutoff switch transitioned from CUTOFF to RUN
08:08:56 Engine 2 fuel cutoff switch also transitions from CUTOFF to RUN
Who (or what?) operated the cutoff switches?
Last edited by Engineless; 11th July 2025 at 21:53 .
Subjects
APU
CCTV
EAFR
FADEC
Fuel (All)
Fuel Cutoff
Fuel Cutoff Switches
Hydraulic Failure (All)
MAYDAY
Pilot "Why did you cut off"
Preliminary Report
RAT (All)
RAT (Deployment)
RUN/CUTOFF
Relight
Timeline (Preliminary Report)
Links are to this post in the relevant subject page so that this post can be seen in context.
Reply to this quoting this original post. You need to be logged in. Not available on closed threads.
July 11, 2025, 21:56:00 GMT
permalink Post: 11919785
Subjects
RAT (All)
Links are to this post in the relevant subject page so that this post can be seen in context.
Reply to this quoting this original post. You need to be logged in. Not available on closed threads.
July 11, 2025, 23:09:00 GMT
permalink Post: 11919886
Time was spent with the verbal exchange, and then perhaps each pilot expected the other to put the switch back?
Anyway, the preliminary report also establishes that the aircraft had only 3-4 seconds of powered flight. (Would the gear lever be operated that early?) Everyone who saw that from the CCTV video, pat yourselves on the back.

Mayday call, dual engine failure, RAT deployment all confirmed.
TCMA was a red herring, the aircraft was firmly in air mode as the accident unfolded, and the thrust levers were at takeoff thrust the whole time.
Subjects
APU
CCTV
Dual Engine Failure
EAFR
Engine Failure (All)
FADEC
Fuel (All)
Fuel Cutoff
Fuel Cutoff Switches
Gear Lever
MAYDAY
Preliminary Report
RAT (All)
RAT (Deployment)
RUN/CUTOFF
Relight
Links are to this post in the relevant subject page so that this post can be seen in context.
Reply to this quoting this original post. You need to be logged in. Not available on closed threads.
July 11, 2025, 23:12:00 GMT
permalink Post: 11919889
I wouldn't put too much significance in the "01 second" since this still is close enough for an unintentional cause.
No matter what: The design and position of the fuel cut off switches is potentially prone for mishaps.
Subjects
Air Worthiness Directives
Engine Failure (All)
FADEC
Fuel (All)
Fuel Cutoff
Fuel Cutoff Switches
RAT (All)
RAT (Deployment)
SAIB NM-18-33
Special Airworthiness Information Bulletin
Weight on Wheels
Links are to this post in the relevant subject page so that this post can be seen in context.
Reply to this quoting this original post. You need to be logged in. Not available on closed threads.
July 12, 2025, 00:25:00 GMT
permalink Post: 11919990
For myself, I have total confidence that the switches functioned as intended. Obviously they commanded the fuel valve as intended, and can be seen intact (other than the plastic caps), and in the run position, so it is safe to conclude that a mechanical/electrical fault of both independent switches at the same moment is unlikely in the extreme. The FDR data states that they were moved to "off" position, which caused the engine shutdown, then returned to "run", so they obviously were mechanically and electrically functional.
The automatic deployment of the RAT is an indicator of the airplane systems sensing an engine shutdown, as is the APU autostart. Pax 11A mentioned the green cabin lights, which, if I understand correctly is an indication of a complete electrical generation failure.The time of all these events can be plotted from recorded data, which I expect we'll see in a full report later. In the mean time, it all makes unfortunate sense.
Subjects
APU
Engine Failure (All)
Engine Shutdown
FDR
Fuel (All)
Fuel Cutoff Switches
Fuel Cutoff Switches (detent)
RAT (All)
RAT (Deployment)
Links are to this post in the relevant subject page so that this post can be seen in context.
Reply to this quoting this original post. You need to be logged in. Not available on closed threads.
July 12, 2025, 00:26:00 GMT
permalink Post: 11919991
Anyway, here goes:
A. Misconfiguration or wrong takeoff data — OUT : 5 tons under MTOW, flaps 5, takeoff roll uneventful
B. Flaps retracted post-takeoff instead of gear — OUT : flaps 5 still set at crash
C. Low-altitude capture — OUT : throttle was at take-off thrust the whole time
D. Loss of both engines at or shortly after rotation — IN: confirmed to have occurred 3-4 seconds after liftoff
I. Bird strike/FOD — OUT
II.Fuel-related
1. Loss of electric fuel pumps — OUT
2. Fuel contamination — as good as OUT , but lab work is ongoing
3. Vapour lock — OUT
III. Improper maintenance — mostly OUT , switches might have been defective
IV. Large-scale electrical fault (e.g. due to water in E&E bay) — OUT . This would have been obvious from the flight recorder.
V. Shutdown of engines by TCMA — OUT . Conditions not met (not on ground, throttle not at idle)
VI. (Inadvertent) shutdown by flight crew
1. Spontaneous execution of memory items (fuel control switches OFF, then ON; deploy RAT) due to assumed engine malfunction — OUT from CVR
2. No indications whatsoever of an intentional shutdown for nefarious reasons — IN but unsupported
VII. Malfunction/mishandling of the fuel cutoff switches (most recent)
1. Wear or improper operation of the switches, so that they do not lock but can shift back into the OFF position. — IN
Read the previous post to this by 9 lives and reconsider VII.1
Senior Pilot
2. Spilled drink leading to short in the wiring — IN (barely) , 8 separate switch contacts must be affected in just the right way
If you never supported any of the theories that are now out, pat yourself on the back!
Last edited by Senior Pilot; 12th July 2025 at 04:40 . Reason: added comment
Subjects
CVR
DFDR
Electrical Failure
Fuel (All)
Fuel Cutoff
Fuel Cutoff Switches
Memory Items
RAT (All)
RAT (Deployment)
Takeoff Roll
Links are to this post in the relevant subject page so that this post can be seen in context.
Reply to this quoting this original post. You need to be logged in. Not available on closed threads.
July 12, 2025, 01:08:00 GMT
permalink Post: 11920029
08:07:33 ATC: Takeoff clearance
08:07:37 A-SMGCS: Aircraft starts rolling
08:08:33 EAFR: V1 153kts
08:08:35 EAFR: Vr 155kts
08:08:39 EAFR: Gnd-Air mode transition
08:08:42 EAFR: Max IAS 180kts, Eng 1/2 Cutoff switches activate within 1 second of each other
08:08:42 CVR: "Why did you cut off", "I did not" (exact time not specified)
08:08:42 A-SMGCS: RAT deployed (exact time not specified)
08:08:47 EAFR: Both engine N2 below min idle. RAT hyd pwr commences
08:08:52 EAFR: Eng 1 cutoff to RUN
08:08:54 EAFR: APU inlet door opens (auto start logic)
08:08:56 EAFR: Eng 2 cutoff to RUN
08:09:05 ATC: Mayday call
08:09:11 EAFR recording stops
Fuel cutoff switches operated within 1 second of each other suggests to me that the locking mechanism wasn't working as per (SAIB) No. NM-18-33. Any loose item could have accidentally (or not) operated the switches (including hands).
Last edited by physicus; 12th July 2025 at 01:24 .
Subjects
APU
CVR
EAFR
Fuel (All)
Fuel Cutoff
Fuel Cutoff Switches
MAYDAY
Pilot "Why did you cut off"
Preliminary Report
RAT (All)
RAT (Deployment)
RUN/CUTOFF
SAIB NM-18-33
Special Airworthiness Information Bulletin
Timeline (Preliminary Report)
V1
Links are to this post in the relevant subject page so that this post can be seen in context.
Reply to this quoting this original post. You need to be logged in. Not available on closed threads.