July 11, 2025, 23:09:00 GMT
permalink Post: 11919886
Time was spent with the verbal exchange, and then perhaps each pilot expected the other to put the switch back?
Anyway, the preliminary report also establishes that the aircraft had only 3-4 seconds of powered flight. (Would the gear lever be operated that early?) Everyone who saw that from the CCTV video, pat yourselves on the back.

Mayday call, dual engine failure, RAT deployment all confirmed.
TCMA was a red herring, the aircraft was firmly in air mode as the accident unfolded, and the thrust levers were at takeoff thrust the whole time.
Subjects
APU
CCTV
Dual Engine Failure
EAFR
Engine Failure (All)
FADEC
Fuel (All)
Fuel Cutoff
Fuel Cutoff Switches
Gear Lever
MAYDAY
Preliminary Report
RAT (All)
RAT (Deployment)
RUN/CUTOFF
Relight
Links are to this post in the relevant subject page so that this post can be seen in context.
Reply to this quoting this original post. You need to be logged in. Not available on closed threads.
July 11, 2025, 23:12:00 GMT
permalink Post: 11919889
I wouldn't put too much significance in the "01 second" since this still is close enough for an unintentional cause.
No matter what: The design and position of the fuel cut off switches is potentially prone for mishaps.
Subjects
Air Worthiness Directives
Engine Failure (All)
FADEC
Fuel (All)
Fuel Cutoff
Fuel Cutoff Switches
RAT (All)
RAT (Deployment)
SAIB NM-18-33
Special Airworthiness Information Bulletin
Weight on Wheels
Links are to this post in the relevant subject page so that this post can be seen in context.
Reply to this quoting this original post. You need to be logged in. Not available on closed threads.
July 12, 2025, 00:25:00 GMT
permalink Post: 11919990
For myself, I have total confidence that the switches functioned as intended. Obviously they commanded the fuel valve as intended, and can be seen intact (other than the plastic caps), and in the run position, so it is safe to conclude that a mechanical/electrical fault of both independent switches at the same moment is unlikely in the extreme. The FDR data states that they were moved to "off" position, which caused the engine shutdown, then returned to "run", so they obviously were mechanically and electrically functional.
The automatic deployment of the RAT is an indicator of the airplane systems sensing an engine shutdown, as is the APU autostart. Pax 11A mentioned the green cabin lights, which, if I understand correctly is an indication of a complete electrical generation failure.The time of all these events can be plotted from recorded data, which I expect we'll see in a full report later. In the mean time, it all makes unfortunate sense.
Subjects
APU
Engine Failure (All)
Engine Shutdown
FDR
Fuel (All)
Fuel Cutoff Switches
Fuel Cutoff Switches (detent)
RAT (All)
RAT (Deployment)
Links are to this post in the relevant subject page so that this post can be seen in context.
Reply to this quoting this original post. You need to be logged in. Not available on closed threads.
July 12, 2025, 00:26:00 GMT
permalink Post: 11919991
Anyway, here goes:
A. Misconfiguration or wrong takeoff data — OUT : 5 tons under MTOW, flaps 5, takeoff roll uneventful
B. Flaps retracted post-takeoff instead of gear — OUT : flaps 5 still set at crash
C. Low-altitude capture — OUT : throttle was at take-off thrust the whole time
D. Loss of both engines at or shortly after rotation — IN: confirmed to have occurred 3-4 seconds after liftoff
I. Bird strike/FOD — OUT
II.Fuel-related
1. Loss of electric fuel pumps — OUT
2. Fuel contamination — as good as OUT , but lab work is ongoing
3. Vapour lock — OUT
III. Improper maintenance — mostly OUT , switches might have been defective
IV. Large-scale electrical fault (e.g. due to water in E&E bay) — OUT . This would have been obvious from the flight recorder.
V. Shutdown of engines by TCMA — OUT . Conditions not met (not on ground, throttle not at idle)
VI. (Inadvertent) shutdown by flight crew
1. Spontaneous execution of memory items (fuel control switches OFF, then ON; deploy RAT) due to assumed engine malfunction — OUT from CVR
2. No indications whatsoever of an intentional shutdown for nefarious reasons — IN but unsupported
VII. Malfunction/mishandling of the fuel cutoff switches (most recent)
1. Wear or improper operation of the switches, so that they do not lock but can shift back into the OFF position. — IN
Read the previous post to this by 9 lives and reconsider VII.1
Senior Pilot
2. Spilled drink leading to short in the wiring — IN (barely) , 8 separate switch contacts must be affected in just the right way
If you never supported any of the theories that are now out, pat yourself on the back!
Last edited by Senior Pilot; 12th July 2025 at 04:40 . Reason: added comment
Subjects
CVR
DFDR
Electrical Failure
Fuel (All)
Fuel Cutoff
Fuel Cutoff Switches
Memory Items
RAT (All)
RAT (Deployment)
Takeoff Roll
Links are to this post in the relevant subject page so that this post can be seen in context.
Reply to this quoting this original post. You need to be logged in. Not available on closed threads.
July 12, 2025, 01:08:00 GMT
permalink Post: 11920029
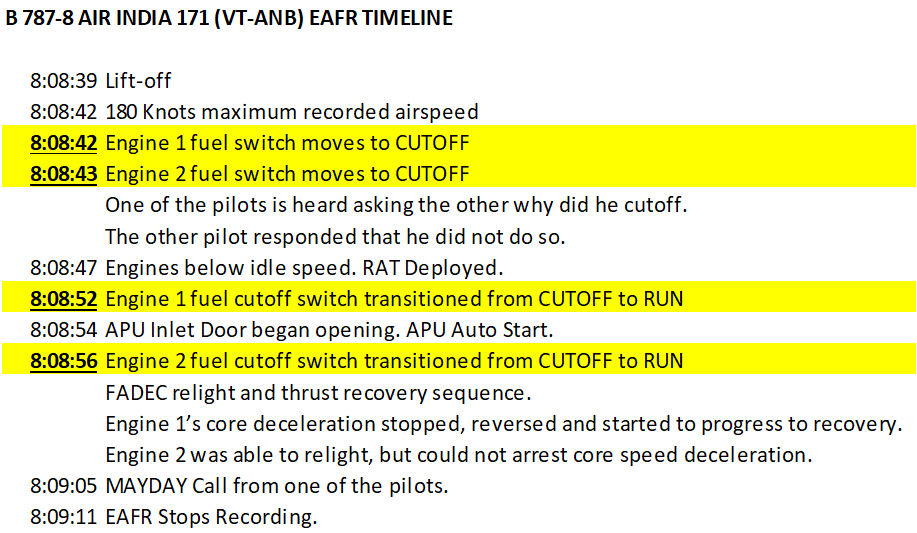
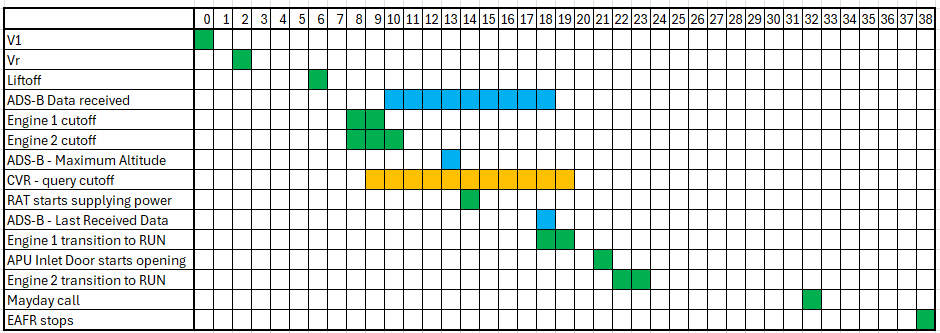
08:07:33 ATC: Takeoff clearance
08:07:37 A-SMGCS: Aircraft starts rolling
08:08:33 EAFR: V1 153kts
08:08:35 EAFR: Vr 155kts
08:08:39 EAFR: Gnd-Air mode transition
08:08:42 EAFR: Max IAS 180kts, Eng 1/2 Cutoff switches activate within 1 second of each other
08:08:42 CVR: "Why did you cut off", "I did not" (exact time not specified)
08:08:42 A-SMGCS: RAT deployed (exact time not specified)
08:08:47 EAFR: Both engine N2 below min idle. RAT hyd pwr commences
08:08:52 EAFR: Eng 1 cutoff to RUN
08:08:54 EAFR: APU inlet door opens (auto start logic)
08:08:56 EAFR: Eng 2 cutoff to RUN
08:09:05 ATC: Mayday call
08:09:11 EAFR recording stops
Fuel cutoff switches operated within 1 second of each other suggests to me that the locking mechanism wasn't working as per (SAIB) No. NM-18-33. Any loose item could have accidentally (or not) operated the switches (including hands).
Last edited by physicus; 12th July 2025 at 01:24 .
Subjects
APU
CVR
EAFR
Fuel (All)
Fuel Cutoff
Fuel Cutoff Switches
MAYDAY
Pilot "Why did you cut off"
Preliminary Report
RAT (All)
RAT (Deployment)
RUN/CUTOFF
SAIB NM-18-33
Special Airworthiness Information Bulletin
Timeline (Preliminary Report)
V1
Links are to this post in the relevant subject page so that this post can be seen in context.
Reply to this quoting this original post. You need to be logged in. Not available on closed threads.
July 12, 2025, 02:28:00 GMT
permalink Post: 11920070
Does the RAT really start providing power in 4 seconds from the E2 fuel cutoff switch RUN -> CUTOFF?
Timeline from AAIB and the public CCTV video:
08:08:33 v1 153 kts
.
08:08:35 vr 155 kts
.
.
.
08:08:39 Liftoff, A/G Air Mode, rotation at 00:18 in public CCTV video
.
.
08:08:42 E1 Fuel Cutoff Switch RUN -> CUTOFF, 180 kts
08:08:43 E2 Fuel Cutoff Switch RUN -> CUTOFF
.............? N1 N2 begin to decrease
.............? "Why did you cutoff", "I didn't"
.............? Airport CCTV shows RAT
.............? N2 < idle speed
08:08:47 RAT hydraulic power
.
08:08:49 Public CCTV video: visible loss of thrust, Alt < 200ft using wingspan
.
.
08:08:52 E1 Fuel Cutoff Switch CUTOFF -> RUN, CCTV video: visible descent
.
08:08:54 APU inlet door begins opening
.
08:08:56 E2 Fuel Cutoff Switch CUTOFF -> RUN
08:09:05 MAYDAY
08:09:11 EAFR Recording stops
08:14:44 Crash Fire Tender leaves airport
Last edited by appruser; 12th July 2025 at 02:29 . Reason: readability
Subjects
AAIB (All)
APU
CCTV
EAFR
Fuel (All)
Fuel Cutoff
Fuel Cutoff Switches
Hydraulic Failure (All)
MAYDAY
Pilot "Why did you cut off"
Preliminary Report
RAT (All)
RAT (Deployment)
RUN/CUTOFF
Timeline (Preliminary Report)
Links are to this post in the relevant subject page so that this post can be seen in context.
Reply to this quoting this original post. You need to be logged in. Not available on closed threads.
July 12, 2025, 04:47:00 GMT
permalink Post: 11920152
Typically you'd have a fault in one set of poles, giving you conflicting data.
Such as the EAFR registers a fuel switch in cutoff, but the fuel did not actually cut off.
Don't forget that the RAT deployed instantly, shortly after liftoff, agreeing that both switches were in CUTOFF.
Literally covering all the bases with a video would not only show what the switch status was but also how it got there, if it has an immediate effect, which a second line would not do.
Subjects
EAFR
Fuel (All)
Fuel Cutoff Switches
RAT (All)
RAT (Deployment)
RUN/CUTOFF
Links are to this post in the relevant subject page so that this post can be seen in context.
Reply to this quoting this original post. You need to be logged in. Not available on closed threads.
July 12, 2025, 08:42:00 GMT
permalink Post: 11920296
08:07:33 ATC: Takeoff clearance
08:07:37 A-SMGCS: Aircraft starts rolling
08:08:33 EAFR: V1 153kts
08:08:35 EAFR: Vr 155kts
08:08:39 EAFR: Gnd-Air mode transition
08:08:42 EAFR: Max IAS 180kts, Eng 1/2 Cutoff switches activate within 1 second of each other
08:08:42 CVR: "Why did you cut off", "I did not" (exact time not specified)
08:08:42 A-SMGCS: RAT deployed (exact time not specified)
08:08:47 EAFR: Both engine N2 below min idle. RAT hyd pwr commences
08:08:52 EAFR: Eng 1 cutoff to RUN
08:08:54 EAFR: APU inlet door opens (auto start logic)
08:08:56 EAFR: Eng 2 cutoff to RUN
08:09:05 ATC: Mayday call
08:09:11 EAFR recording stops
Fuel cutoff switches operated within 1 second of each other suggests to me that the locking mechanism wasn't working as per (SAIB) No. NM-18-33. Any loose item could have accidentally (or not) operated the switches (including hands).
Last edited by sorvad; 12th July 2025 at 09:03 . Reason: Clarification
Subjects
APU
CVR
EAFR
Fuel (All)
Fuel Cutoff
Fuel Cutoff Switches
MAYDAY
Pilot "Why did you cut off"
Preliminary Report
RAT (All)
RAT (Deployment)
RUN/CUTOFF
SAIB NM-18-33
Special Airworthiness Information Bulletin
Timeline (Preliminary Report)
V1
Links are to this post in the relevant subject page so that this post can be seen in context.
Reply to this quoting this original post. You need to be logged in. Not available on closed threads.
July 12, 2025, 09:17:00 GMT
permalink Post: 11920331
This could explain the the assumption that it took ten seconds to reverse the switch positions.
Cut off could have been noticed at any point later than 08:08:42 but before 08:08:52.
Subjects
AAIB (All)
Fuel (All)
Fuel Cutoff Switches
Pilot "Why did you cut off"
Preliminary Report
RAT (All)
RAT (Deployment)
Timeline (Preliminary Report)
Links are to this post in the relevant subject page so that this post can be seen in context.
Reply to this quoting this original post. You need to be logged in. Not available on closed threads.
July 12, 2025, 09:56:00 GMT
permalink Post: 11920377
The report says,
It suggests to me that the RAT deployment was initiated while the engines were still above idle and generating electrical power. Obviously one of the pilots could have done it via depressing the switch, as it's a "dual engine failure/stall" memory item (see Air India Ahmedabad accident 12th June 2025 Part 2 ) that won't hurt anything.
Is there a way for the RAT to deploy while the engines are still above idle?
Subjects
EAFR
Fuel (All)
Fuel Cutoff
Fuel Cutoff Switches
Hydraulic Failure (All)
RAT (All)
RAT (Deployment)
Links are to this post in the relevant subject page so that this post can be seen in context.
Reply to this quoting this original post. You need to be logged in. Not available on closed threads.
July 12, 2025, 12:00:00 GMT
permalink Post: 11920493
Subjects
RAT (All)
RAT (Deployment)
Links are to this post in the relevant subject page so that this post can be seen in context.
Reply to this quoting this original post. You need to be logged in. Not available on closed threads.
July 12, 2025, 12:02:00 GMT
permalink Post: 11920495
On the 787-8, as all modern planes, switches are not cabled as dry closing contacts all the way from the switch poles to the affected end devices (FADECs in the case of fuel cutoff switches), but rather connect locally to an analogue/digital converter to encode the switch position data onto the digital comms bus ARINC629 which allows all aircraft systems to talk to one another.
Are the fuel cutoff switches, which are positioned adjacent to the stab trim switches, connected to the same ADC module which produced the error message on the previous flight, which maintenance was unable to resolve before the accident flight took off? I do not know, but it must be worthy of being looked into.
I think they're called remote data concentrators - in many cases it is a conversion from a direct digital input to a bus signal; electronics would not call it an 'analog' input unless it was actually measuring a quantitative value.
The report says,
As per the EAFR data both engines N2 values passed below minimum idle speed, and the RAT hydraulic pump began supplying hydraulic power at about 08:08:47 UTC.
This was 5 seconds after the fuel was cut off.
It suggests to me that the RAT deployment was initiated while the engines were still above idle and generating electrical power. Obviously one of the pilots could have done it via depressing the switch, as it's a "dual engine failure/stall" memory item (see Air India Ahmedabad accident 12th June 2025 Part 2 ) that won't hurt anything.
Is there a way for the RAT to deploy while the engines are still above idle?
That is a very good question IMHO.
Subjects
EAFR
Fuel (All)
Fuel Cutoff
Fuel Cutoff Switches
Generators/Alternators
Hydraulic Failure (All)
Preliminary Report
RAT (All)
RAT (Deployment)
Links are to this post in the relevant subject page so that this post can be seen in context.
Reply to this quoting this original post. You need to be logged in. Not available on closed threads.
July 12, 2025, 12:39:00 GMT
permalink Post: 11920545
The timing of data loss seemingly lining up with the first cutoff switch being flipped back to RUN seems a little too coincidental to me, but again hopefully someone with relevant knowledge has a mundane explanation for this.
On top of that I feel like people are overestimating how long ten seconds actually is, especially considering some of those seconds are reported to have been taken up by confused dialogue (that isn't even reported in its entirety). I thought it was common wisdom that accidents are never down to one thing; it would be light-years from being the first time that suboptimal crew response turned a maybe-recoverable error into a definite disaster without an ounce of malice in the mix.
Subjects
ADSB
Action slip
Fuel (All)
Fuel Cutoff Switches
RAT (All)
RAT (Deployment)
RUN/CUTOFF
Links are to this post in the relevant subject page so that this post can be seen in context.
Reply to this quoting this original post. You need to be logged in. Not available on closed threads.
July 12, 2025, 12:46:00 GMT
permalink Post: 11920554
The report says,
It suggests to me that the RAT deployment was initiated while the engines were still above idle and generating electrical power. Obviously one of the pilots could have done it via depressing the switch, as it's a "dual engine failure/stall" memory item (see Air India Ahmedabad accident 12th June 2025 Part 2 ) that won't hurt anything.
Is there a way for the RAT to deploy while the engines are still above idle?
Subjects
EAFR
Fuel (All)
Fuel Cutoff
Fuel Cutoff Switches
Hydraulic Failure (All)
RAT (All)
RAT (Deployment)
Links are to this post in the relevant subject page so that this post can be seen in context.
Reply to this quoting this original post. You need to be logged in. Not available on closed threads.
July 13, 2025, 13:19:00 GMT
permalink Post: 11921280
It appears that we went from a position of loss of both engines (i.e. trigger for auto RAT deployment) to RAT supplying power within between 3 and 5 seconds.
Does anyone know:
1. How long the RAT takes to deploy and generate power from point of trigger?
2. Is it the act of engine loss (from fuel shutoff) that is the auto trigger, or the sub idle power that is the trigger (in which case this would take around 1 of these seconds)?
Also, at peak IAS of 180kts, presumably less by the time RAT is actually deployed, combined with the RAT drag and a minimum speed of 130kts for (reliable) RAT performance, I assume that the RAT would not in fact have provided power for all that long in truth?
Subjects
RAT (All)
RAT (Deployment)
Links are to this post in the relevant subject page so that this post can be seen in context.
Reply to this quoting this original post. You need to be logged in. Not available on closed threads.
July 13, 2025, 18:40:00 GMT
permalink Post: 11921477
I have a couple of questions. Forgive me for being late into this thread if any of them is already discussed:
1) I just read this in a Boeing manual:
- They send signals to the remote data concentrators (RDC) and the spar valve start switch relays.
- The spar valve start switch relays use these signals to control the spar valve and the high pressure shut off valve (HPSOV) in the fuel metering unit (FMU).
- The RDCs send the signals to the common data network (CDN) and then to the electronic engine control (EEC) to operate the FMU fuel valves (FMV and HPSOV).
The fuel control switches have 2 positions:
- RUN
- CUTOFF.
You must pull the switch out of a detent to select a position.
2) Looking at the incident timeline, one of the pilots takes corrective action to reswitch to RUN position 10 seconds after maximum air speed is reached and 5 seconds after RAT is deployed. Is this normal?
It's not clear however that whether their conversation is after or before the RAT is deployed.
(No visual or auditory cues in the cockpit for a critical fuel switch action? Not hearing the engines shutting down?)
3) The same pilot that turns on Engine 1's fuel switch, turns on Engine 2's switch 4 whole seconds later. Why not consecutively, right one after the other, just like they were turned off one second apart?
If only he had done so the second engine might have recovered in time as well.
4) This aircraft's TCM has been replaced in 2019 and 2023, not related to a fuel switch issue. And there had been no fuel switch defect reports since 2023. One begs to ask if there had been a fuel switch defect report back in 2023 and what was the nature of it?
Are TCM's replaced as a whole, including the switches, twice? If so, why wouldn't they install a TCM version at least in 2023 with redesigned switches (w/ enhanced locking mechanism) mentioned in the FAA SAIB? Have they installed old/used TCM's manufactured prior to 2018 SAIB?
Please note that the RH and LH GE engines of the aircraft were only installed in March 2025 and May 2025 respectively, but they were used and dating from 2013 and 2012. Is this normal for a 12 year old Boeing aircraft to change so many mission critical components?
Electronic parts somehow, but how durable are those GE engines?
Thanks,
C.A.
When reading any of the data when it comes out, pay some attention to the sampling rate of the data being provided, it is quite possible to make erroneous assumptions where that is not taken into consideration. The data buses used to get data from the aircraft system to the recorder, and the recorders themselves use sequential sentences, and varyious rates.
IMHO.
Subjects
FAA
Fuel (All)
Fuel Cutoff Switches
Fuel Cutoff Switches (detent)
High Pressure Shutoff Valve
RAT (All)
RAT (Deployment)
RUN/CUTOFF
Spar Valves
Special Airworthiness Information Bulletin
Links are to this post in the relevant subject page so that this post can be seen in context.
Reply to this quoting this original post. You need to be logged in. Not available on closed threads.
July 13, 2025, 19:03:00 GMT
permalink Post: 11921493
As I understand it from previous discussions, without the APU, all electrical power except for that DC power provided by battery to essential systems would have been lost.
With the copilot as PF, would he have lost his instrument displays? If so, possibly additional startle effect and workload for him.
Why did the ADS-B information keep going on for so long? My understanding from previous threads was that loss of ADS-B was considered an indication of loss of electrical power.
What else would be expected with loss of power?
Some general speculation: I find it hard to understand the long delay from what must have been the onset of obvious issues to the time the first engine is set to "RUN". I wonder if much more cockpit dialog intervened, e.g. PF requesting PM to turn the fuel switches back on (since he had his hands full), and eventually operating the switches himself, with the delay and time gap between the two switches being turned to "RUN" being attributable to being preoccupied with flying the aircraft under trying conditions.
Subjects
ADSB
APU
Fuel (All)
Fuel Cutoff Switches
Preliminary Report
RAT (All)
RAT (Deployment)
RUN/CUTOFF
Startle Effect
Links are to this post in the relevant subject page so that this post can be seen in context.
Reply to this quoting this original post. You need to be logged in. Not available on closed threads.
July 13, 2025, 19:39:00 GMT
permalink Post: 11921522
As I understand it from previous discussions, without the APU, all electrical power except for that DC power provided by battery to essential systems would have been lost.
With the copilot as PF, would he have lost his instrument displays? If so, possibly additional startle effect and workload for him.
Why did the ADS-B information keep going on for so long? My understanding from previous threads was that loss of ADS-B was considered an indication of loss of electrical power.
What else would be expected with loss of power?
Some general speculation: I find it hard to understand the long delay from what must have been the onset of obvious issues to the time the first engine is set to "RUN". I wonder if much more cockpit dialog intervened, e.g. PF requesting PM to turn the fuel switches back on (since he had his hands full), and eventually operating the switches himself, with the delay and time gap between the two switches being turned to "RUN" being attributable to being preoccupied with flying the aircraft under trying conditions.
There seems to be a period around second 12/13 post V1 where engines are (or should) be likely below idle, but prior to RAT power generation.
Note that the report explicitly states the RAT started providing hydraulic power 5 seconds after engine shutdown commenced. It doesn't reference electrical power. So we don't know whether this was at the same time - others may clarify re: RAT operation.
But either way, it would appear there would be a gap in power (which, incidentally, would tie in with the survivor commentary). But yet ADS data continued.
If in fact there was a momentary loss of power then that would contribute heavily to the startle and "delay" in refiring (although comments here make me think there wasn't really such a delay anyway).
(And incidentally would make what appears to be a really rather valiant attempt to save the aircraft even more impressive)
Subjects
ADSB
APU
Engine Failure (All)
Engine Shutdown
Fuel (All)
Fuel Cutoff Switches
Hydraulic Failure (All)
Preliminary Report
RAT (All)
RAT (Deployment)
RUN/CUTOFF
Startle Effect
V1
Links are to this post in the relevant subject page so that this post can be seen in context.
Reply to this quoting this original post. You need to be logged in. Not available on closed threads.
July 14, 2025, 21:36:00 GMT
permalink Post: 11922482
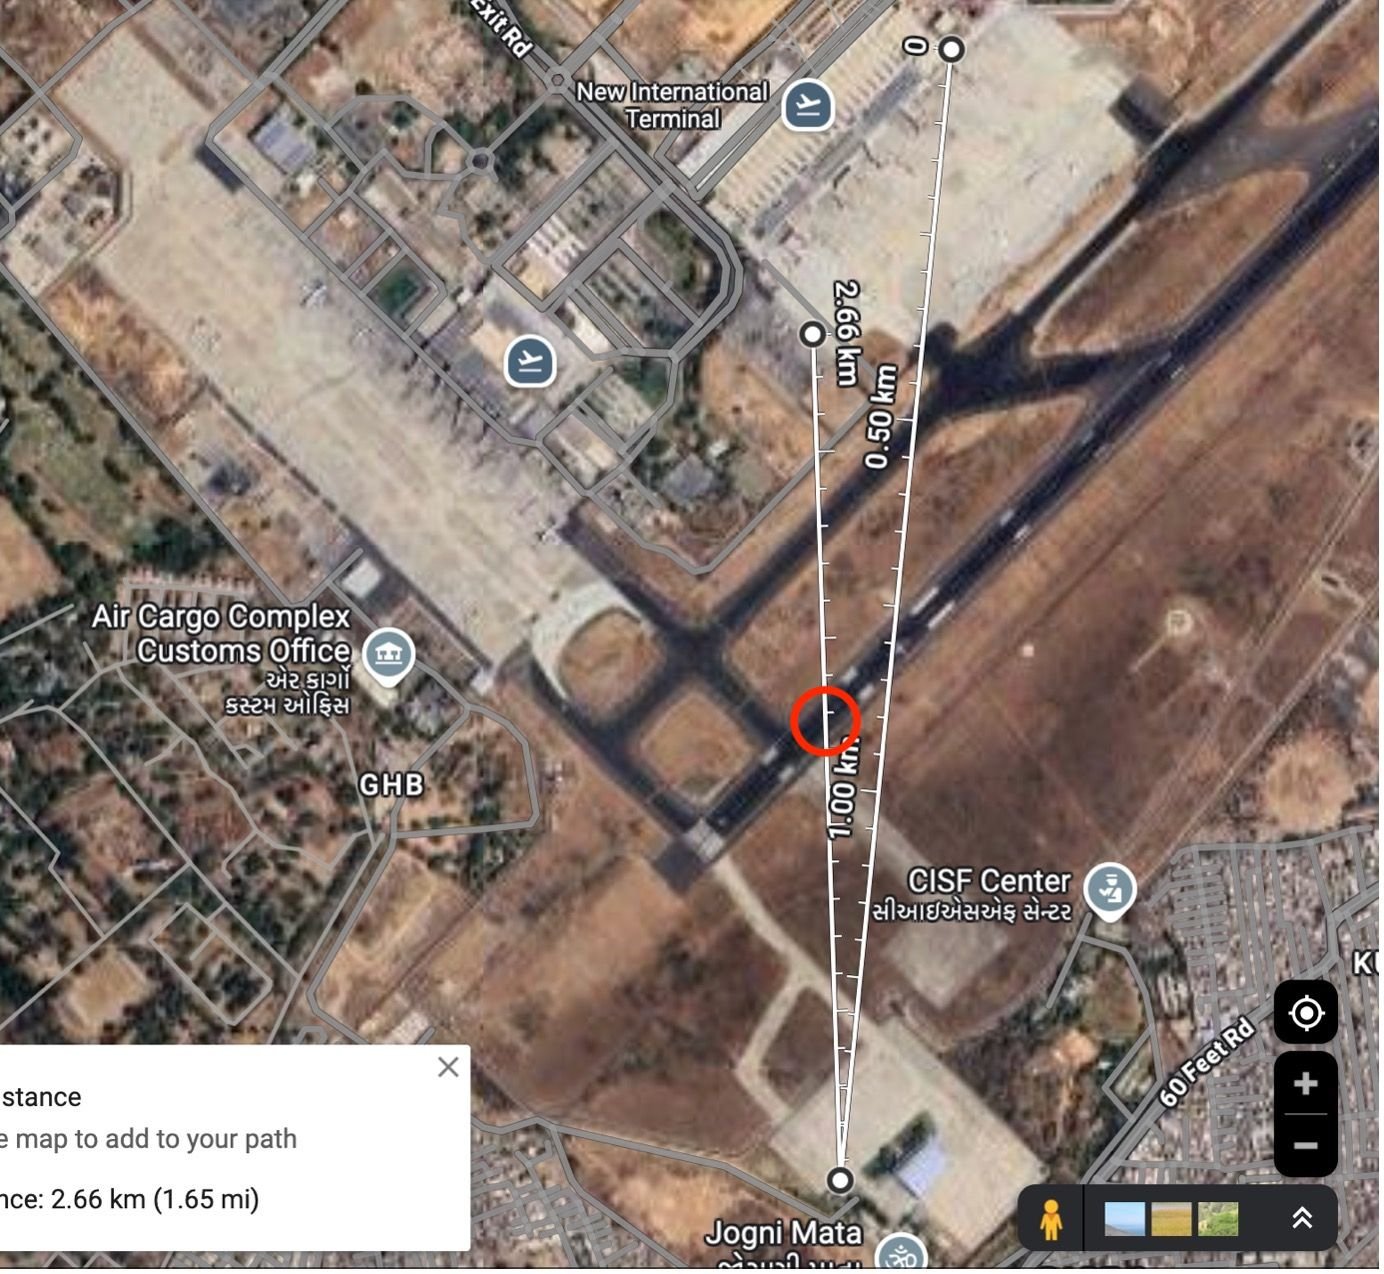
The deemed position of the CCTV camera is only an estimate, based on visual cues. I'm happy to share my workings, should anyone find it useful to cross-reference this with other data they are working on, but I will avoid cluttering up the thread any further until/unless it becomes relevant.
You're looking for the point where the LEFT of the two white lines intersects the runway (ignore the white dots):
Subjects
CCTV
Preliminary Report
RAT (All)
RAT (Deployment)
Links are to this post in the relevant subject page so that this post can be seen in context.
Reply to this quoting this original post. You need to be logged in. Not available on closed threads.
July 14, 2025, 22:36:00 GMT
permalink Post: 11922527
The deemed position of the CCTV camera is only an estimate, based on visual cues. I'm happy to share my workings, should anyone find it useful to cross-reference this with other data they are working on, but I will avoid cluttering up the thread any further until/unless it becomes relevant.
You're looking for the point where the LEFT of the two white lines intersects the runway (ignore the white dots):
Subjects
ADSB
CCTV
FlightRadar24
Preliminary Report
RAT (All)
RAT (Deployment)
Links are to this post in the relevant subject page so that this post can be seen in context.
Reply to this quoting this original post. You need to be logged in. Not available on closed threads.